
Introduction
In today’s fast-paced digital world, keeping an eye on the health and performance of your applications and infrastructure is crucial. One of the best ways to achieve this is by setting up a robust monitoring system, and Grafana is an exceptional tool for this purpose. In this blog post, I’ll walk you through the process of creating a monitoring dashboard using Grafana on an AWS EC2 t1.micro instance running Ubuntu. We’ll also integrate Loki and Promtail to capture and visualize logs, focusing on monitoring an Nginx installation as an example.
Before we dive into the installation and configuration, let’s go over the prerequisites to ensure a smooth setup.
Prerequisites
- AWS EC2 Instance: You should have an AWS account and access to the EC2 service. Launch an EC2 t1.micro instance with Ubuntu (or any Linux distribution of your choice). Make sure you have SSH access to your EC2 instance.
2.Basic Linux Skills:
Familiarity with basic Linux command-line operations is essential.
- Configure your AWS security group: Configure your AWS security group to allow incoming traffic on ports 22 (SSH) and 3000 (Grafana).
Now that we’ve covered the prerequisites, let’s move on to the installation and configuration steps.
Installation Steps
Step 1: SSH into your AWS EC2 Instance
Open your terminal and use the SSH command to connect to your EC2 instance:
ssh -i <your-key.pem> ubuntu@<your-ec2-public-ip>
Step 2: Update and Upgrade
Ensure that your system packages are up to date by running the following commands:
sudo apt update
sudo apt upgrade -y
Step 3: Install Grafana
Add the Grafana APT repository and install Grafana using these commands:
sudo apt install -y software-properties-common
sudo add-apt-repository "deb https://packages.grafana.com/oss/deb stable main"
wget -q -O - https://packages.grafana.com/gpg.key | sudo apt-key add -
sudo apt update
sudo apt install grafana -y
Step 4: Start and Enable Grafana
Start the Grafana service and enable it to start on boot:
sudo systemctl start grafana-server
sudo systemctl enable grafana-server
Step 5: Install Loki and Promtail (for Log Collection)
Download and install Loki and Promtail using the official Loki repository:
Download Loki Config
wget https://raw.githubusercontent.com/grafana/loki/v2.8.0/cmd/loki/loki-local-config.yaml -O loki-config.yaml
Run Loki Docker container
docker run -d --name loki -v $(pwd):/mnt/config -p 3100:3100 grafana/loki:2.8.0 --config.file=/mnt/config/loki-config.yaml
Download Promtail Config
wget https://raw.githubusercontent.com/grafana/loki/v2.8.0/clients/cmd/promtail/promtail-docker-config.yaml -O promtail-config.yaml
Run Promtail Docker container
docker run -d --name promtail -v $(pwd):/mnt/config -v /var/log:/var/log --link loki grafana/promtail:2.8.0 --config.file=/mnt/config/promtail-config.yaml
2 images created.
Step 6: Configure Nginx Logs for Loki and Promtail
Configure Nginx to log access and error logs to a JSON format that Loki can understand. Update your Nginx site configuration file accordingly.
Step 7: Configure Loki and Promtail
Configure Promtail to scrape the Nginx log files and send them to Loki. Ensure the Promtail configuration file reflects the correct log file paths.
Step 8: Access the Grafana Web Interface
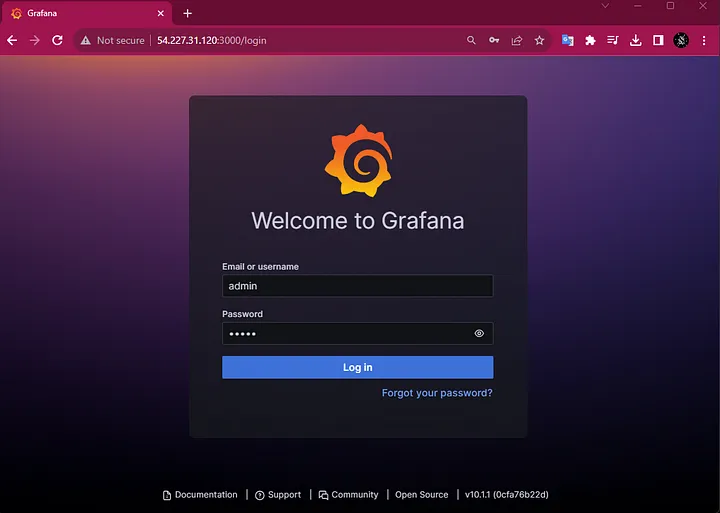
Open a web browser and navigate to your EC2 instance’s public IP address on port 3000 (http://:3000).
Log in with the default credentials (username: admin, password: admin).
Grafana Login
Change your password and set up data sources for Loki and Prometheus.
Step 9: Configure Loki Data Source
In the “Add data source” page, search for “Loki” in the list of available data sources and click on it.
In the “HTTP” section, enter the Loki URL as http://localhost:3100 since Loki is running on the same server.
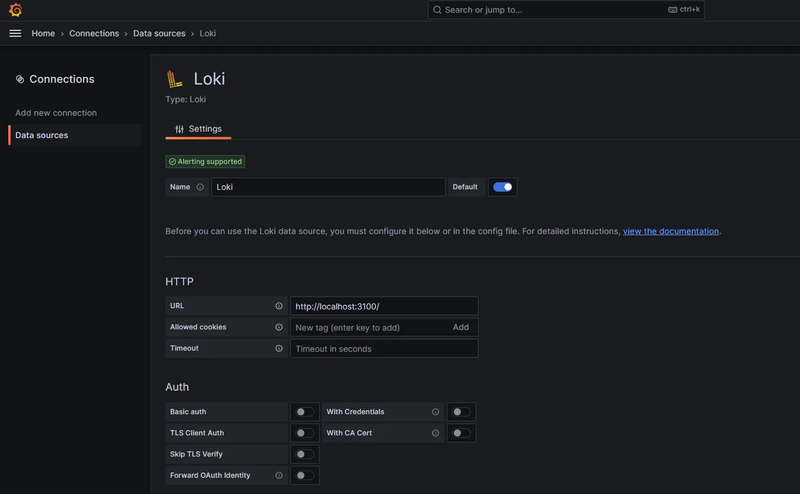
Data Source
Step 10: Scroll down to the “Label filters” section.
Click on the “Add value” button next to the “job” label filter.
Enter “varlogs” as the value for the “job” label filter. This filter will help you narrow down logs from the “varlogs” job.
Add the label to see logs
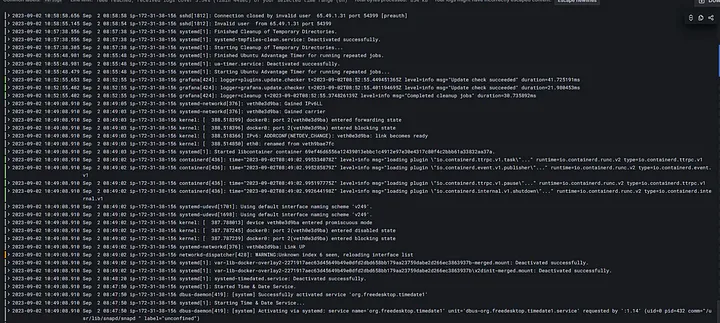
Step 11: Click on Run query
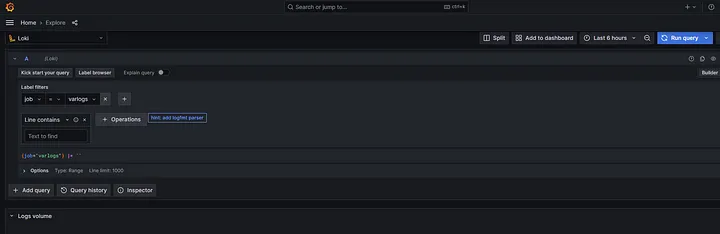
Varlogs
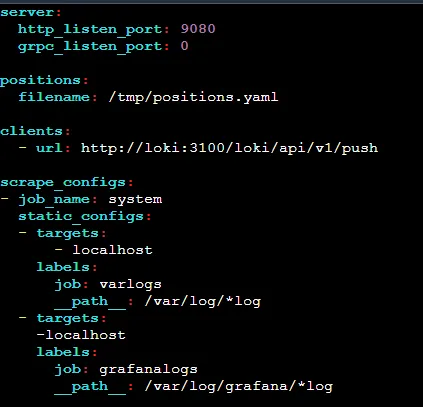
Step 12: You can add other log sources to Promtail.yaml.
Edited Promtail.yaml
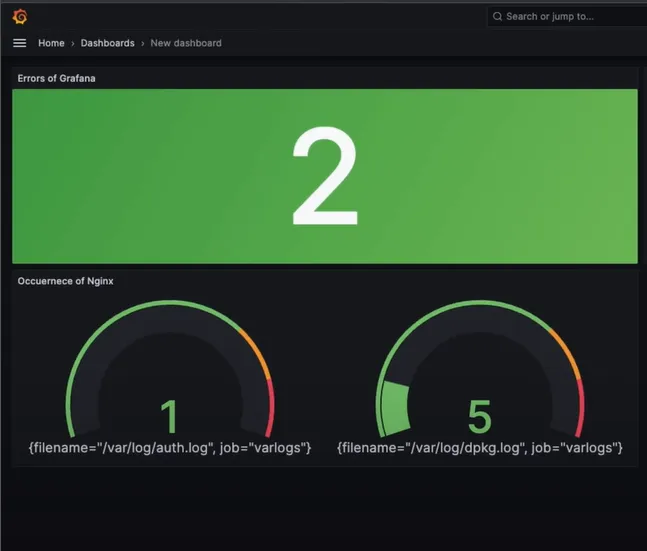
Finally, we can see our Nginx logs monitoring dashboard.
Final Dashboard.
Conclusion
In conclusion, we’ve successfully created a powerful monitoring dashboard that allows us to track and analyze Nginx logs with precision and ease. By combining Grafana, Loki, and Promtail on an AWS EC2 t1.micro instance running Ubuntu, we’ve harnessed the capabilities of these tools to visualize and gain insights from our log data.
With our Grafana dashboard configured to use Loki as a data source and equipped with label filters, we can efficiently focus on monitoring specific aspects of our infrastructure, such as the “varlogs” job. This setup not only simplifies log monitoring but also enables us to proactively detect issues, troubleshoot problems, and ensure the smooth operation of our Nginx server.
By extending the power of Grafana and Loki, we’ve taken a significant step toward improving the overall health and performance of our applications and infrastructure, making our system more robust and reliable. This monitoring solution is a valuable asset in the world of DevOps, enabling us to stay ahead of potential issues and ensure the seamless operation of our services.


Top comments (1)
One of my go-to tools, I often pair it with Prometheus as a datasource to visualize metrics.