- Introduction:
- Why Does This Blog Exist?
- Prerequisites:
- Get the token using the oc command-line tool and console UI.
- Python Code:
- Conclusion:
Disclosure: Please note that the content in this blog was written with the assistance of OpenAI's ChatGPT language model.
Introduction:
Prometheus, an open-source systems monitoring and alerting toolkit, is a popular choice for gathering metrics in Kubernetes and OpenShift environments. It provides a simple yet powerful query language (PromQL), enabling users to select and aggregate time series data in real-time. This article presents a simple Python script to access the Prometheus API securely on an OpenShift platform.
Why Does This Blog Exist?
The purpose of this blog post is to demonstrate a method to consolidate data obtained from multiple PromQL queries into a single row using Python. We chose this approach because of the inherent limitations of PromQL in presenting data from multiple queries as a single row.
- Overcoming PromQL Limitations: PromQL is a powerful and flexible language for querying metrics in Prometheus. However, it does not inherently allow for the generation of a single row of data from multiple queries. Usually, you would perform separate queries for each type of data you want, and then use another tool, such as Grafana, for visualization and processing of the data.
- Leveraging Python for Data Consolidation: Python comes in as a practical solution to this challenge. It's not only a versatile and popular programming language but also has a rich ecosystem of libraries for data manipulation and analysis. With Python, we can execute multiple PromQL queries, fetch the results, and consolidate them into a single row. This way, we can create a composite picture of the metrics we are interested in, overcoming the limitations posed by PromQL.
- Automation and Flexibility: Beyond the data consolidation, Python allows us to automate the process and offers the flexibility to customize how we fetch, analyze, and present data from Prometheus. It enables the creation of a script that periodically pulls and processes data, tailoring the output format to our specific needs.
Prerequisites:
To follow along with this article, you will need:
- A running OpenShift cluster with Prometheus installed.
- Basic knowledge of Python and PromQL.
- Access to the OpenShift command-line interface or API.
In the given script, we demonstrate how to gather specific metrics using Python and PromQL. Our script fetches metrics for node memory utilization, CPU utilization, and pod CPU and memory usage.
Get the token using the oc command-line tool and console UI.
First, you need to be logged into the OpenShift cluster from your terminal. If you haven't done so already, use the oc login command:
oc login --server=https://<openshift-cluster-url>:6443
You will be prompted to enter your username and password.
After you have successfully logged in, you can retrieve your token by executing the following command:
oc whoami -t
This command will print your token to the console.
Please remember that the OpenShift token is sensitive information. Do not share it or publish it. Treat it the same way you would treat a password.
You can also retrieve the token via the OpenShift Console UI by following these steps:
- Log in to the OpenShift Console UI. Example https://console-openshift-console.apps.hubztp.telco.ocp.run/
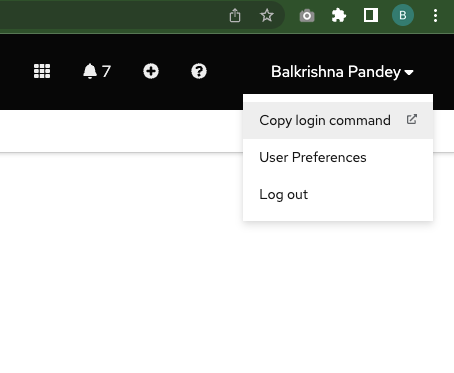
- Click on your username in the top right corner of the screen.
- Select 'Copy Login Command' from the dropdown menu.
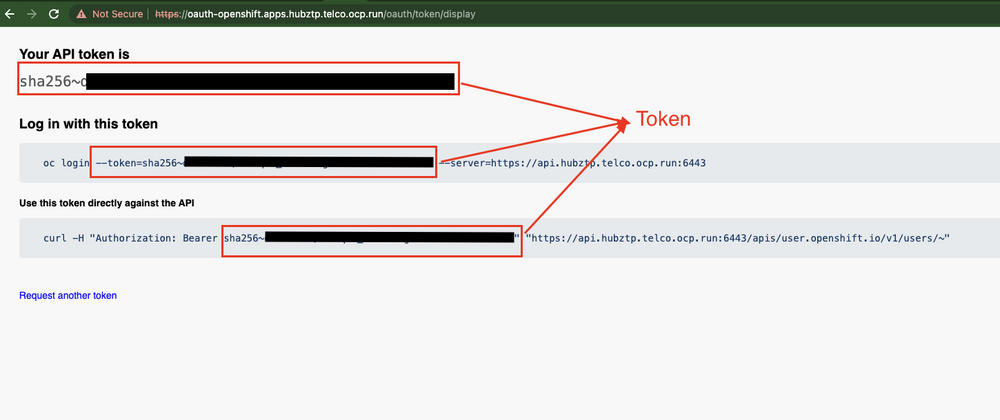
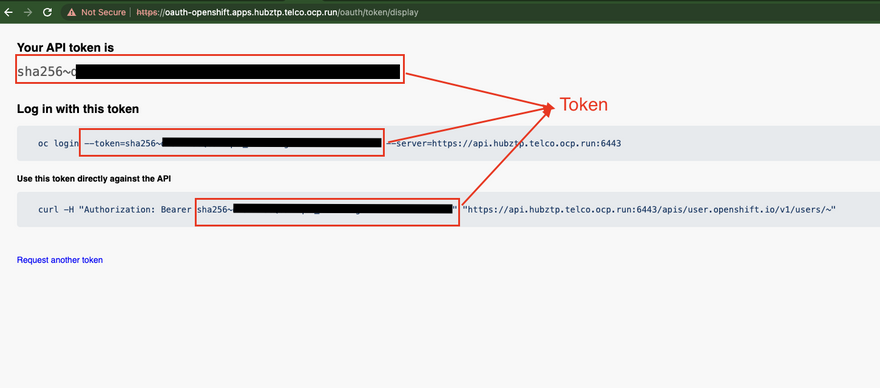
- A new browser tab will open. Click on 'Display Token'.
- Your token will be displayed under 'Token'. Click 'Copy' to copy it to the clipboard.
Python Code:
First, import the required Python modules.
import requests
import json
import urllib3
import time
Define the Prometheus URL and your OpenShift token. Make sure to replace and sha256~ with your actual cluster name and token.
prometheus_url = "https://prometheus-k8s-openshift-monitoring.apps.<cluster-name>/"
token = "sha256~<token>"
Since we are dealing with an insecure HTTPS endpoint, we suppress warnings related to this. In a production environment, you should consider using valid SSL certificates.
urllib3.disable_warnings(urllib3.exceptions.InsecureRequestWarning)
We define a set of PromQL queries for the metrics we want to retrieve.
queries = {
    'node_memory_utilization': '(node_memory_MemTotal_bytes - node_memory_MemAvailable_bytes) / node_memory_MemTotal_bytes',
    'cpu_utilization': '100 - (avg by (instance) (irate(node_cpu_seconds_total{mode="idle"}[5m])) * 100)',
    'pod_cpu_usage': 'sum(rate(container_cpu_usage_seconds_total{container!="POD",pod!=""}[5m])) by (pod)',
    'pod_memory_usage': 'sum(container_memory_usage_bytes{container!="POD",pod!=""}) by (pod)',
}
We initialize a dictionary to hold the results of our queries.
results = {}
Then, we define our headers, which will include our OpenShift token for authorization.
headers = {
    "Authorization": "Bearer " + token,
}
Next, we loop over our queries. For each query, we make a GET request to the Prometheus API. If the request returns an empty result, we wait one second and try again, up to a maximum of five attempts.
If an error occurs during the request, we log the error and wait one second before trying again.
After successfully retrieving the data, we add the results to our results dictionary.
# Fetch data for each query
for query_name, query in queries.items():
    for attempt in range(5):
        try:
            print(f"Running query: {query_name}, attempt: {attempt+1}")
            response = requests.get(f'{prometheus_url}/api/v1/query', params={'query': query}, headers=headers, verify=False)
            data = json.loads(response.text)
            # print(data)

            # Check if the query was successful
            if data['status'] == 'success':
                # If data is not empty, break the loop
                if len(data['data']['result']) > 0:
                    results[query_name] = data['data']['result']
                    break
                else:
                    print(f"No data for query '{query_name}', retrying in 1 second.")
            else:
                print(f"Failed to fetch data for query '{query_name}'. Response: {data}")
            time.sleep(1)  # Wait for a while before next attempt

        except Exception as e:
            print(f"An error occurred while processing query '{query_name}': {e}")
            time.sleep(1)
Finally, we print the results.
# Print the results
for query_name, data in results.items():
    print(f"\n{query_name}:")
    for result in data:
        print(f"  {result}")
Combining the Results into a Single JSON Document
Now we can combine results of each PromQL and create a single json document. To achieve this, I have added a function called combine_results() in our script.
def combine_results(results):
    combined_results = {}
    for query_name, data in results.items():
        combined_results[query_name] = {}
        for result in data:
            key = result['metric'].get('instance', result['metric'].get('pod', 'default'))
            value = result['value'][1]
            combined_results[query_name][key] = value
    json_doc = json.dumps(combined_results)
    return json_doc
This function takes the dictionary of results, which contains individual results for each PromQL query, as input. It loops through each result set, extracting the metric names and their corresponding values.
The function creates a new dictionary for each query, where each dictionary has keys that correspond to the instance or pod in the metrics and values that correspond to the values in the query result. In this way, the data for each query is consolidated into one dictionary, keyed by the instance or pod name.
Finally, the function combines these dictionaries into a larger dictionary, keyed by the query names, and converts it to a JSON document using the json.dumps() function. This JSON document represents the combined results of all queries in a structured and easily readable format.
Now you can call this function as follows,
json_doc = combine_results(results)
print(json_doc)
Conclusion:
That's a wrap.
PromQL is a fantastic tool, no doubt about it. But it has its quirks, and one of them is its inability to generate single-row data from multiple queries directly. This sent us on a quest for a solution, and Python stepped up to the plate, proving once again why it's so beloved in the world of programming.
Armed with Python, we've successfully executed multiple PromQL queries, managed zero data responses, and collated all the results into a neat, easy-to-read JSON document. It's a testament to the flexibility and power of Python, and I hope it inspires you to discover more ways Python can simplify your data processing tasks.
So, as we conclude this tutorial, remember that the power to transform and present your data in meaningful ways is in your hands. Happy coding!


Top comments (0)