
Installing Prometheus and Grafana of primary machine:
- Go to the https://prometheus.io/download/ and copy the link address for prometheus-2.49.0-rc.1.linux-amd64.tar.gz
wget https://github.com/prometheus/prometheus/releases/download/v2.49.0-rc.1/prometheus-2.49.0-rc.1.linux-amd64.tar.gz
- Extract the binary file.
tar xvfz prometheus-2.49.0-rc.1.linux-amd64.tar.gz
- Navigate to the extracted directory
cd prometheus-2.49.0-rc.1.linux-amd64.tar.gz
- Start the Prometheus server.
./prometheus
- Now you can access the prometheus server on port 9090.
http://{ip of your virtual machine}:9090/
Now on the same machine (primary machine) we will be installing grafana.
- Before installing Grafana, ensure your system has the necessary packages. Run the following commands:
sudo apt-get update sudo apt-get install -y apt-transport-https software-properties-common wget
- Add Grafana GPG key to ensure package integrity:
wget -q -O - https://packages.grafana.com/gpg.key | sudo apt-key add
- Add stable repository of Grafana:
echo "deb https://packages.grafana.com/enterprise/deb stable main" | sudo tee -a /etc/apt/sources.list.d/grafana.list
- Update repository and Install Grafana:
sudo apt-get update -y
sudo apt install grafana -y
- Start the Grafana server:
sudo systemctl daemon-reload
sudo systemctl start grafana-server
- Check the status of the Grafana server to ensure it’s running:
sudo systemctl status grafana-server
- Now you can access the grafana server on port 3000:
http://{ip of your virtual machine}:3000
Now lets work on Node machine( The one which we want to monitor)
- Go to the https://prometheus.io/download/#node_exporter and copy the link address for node_exporter-1.7.0.darwin-amd64.tar.gz
wget https://github.com/prometheus/node_exporter/releases/download/v1.7.0/node_exporter-1.7.0.darwin-amd64.tar.gz
- Extract the binary file.
tar xvfz node_exporter-1.7.0.darwin-amd64.tar.gz
- Navigate to the extracted directory
cd node_exporter-1.7.0.darwin-amd64.tar.gz
- Start the Node exporter server.
./node_exporter
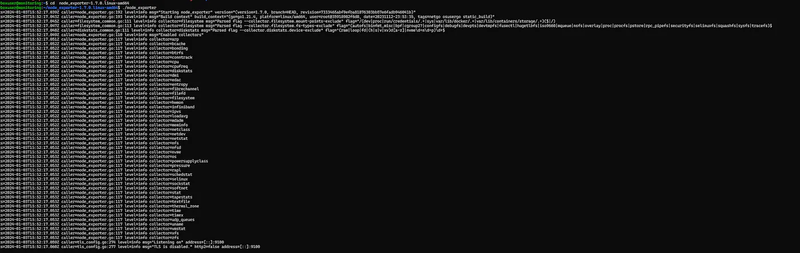
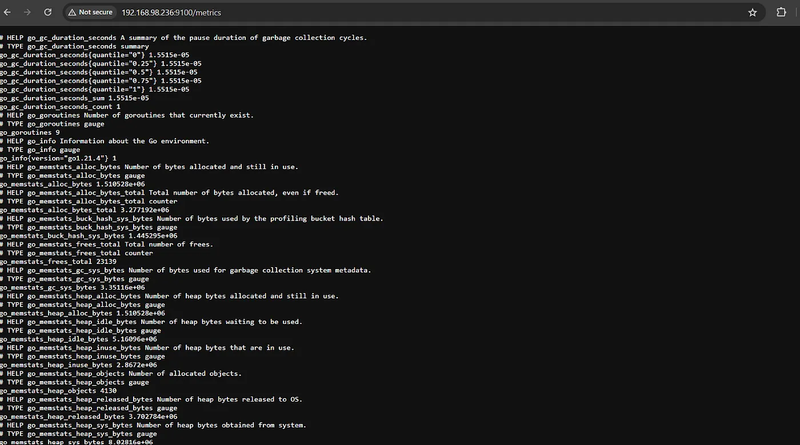
- Now you can access the node exporter server on port 9100.
http://{ip of your virtual machine}:9100/
Now that we’ve installed both Prometheus and Node Exporter on our servers, let’s configure Prometheus to collect scrape data from Node Exporter.
We will work in our primary machine now.
Step 1: Edit Prometheus Configuration
Open your Prometheus configuration file, typically named prometheus.yml:
global:
scrape_interval: 15s
scrape_configs:
- job_name: node
static_configs:
- targets: ['localhost:9100','100.0.0.3:9100']
In the above configuration, replace ‘100.0.0.3’ with the actual IP address or hostname of your remote server running Node Exporter. This configuration tells Prometheus to scrape metrics from both the local Node Exporter (localhost:9100) and the remote server (100.0.0.3:9100).
Step 2: Save the Configuration as YAML something like exporter.yml.
Step 3:Start Prometheus with the New Configuration.
Now, start the Prometheus server by passing the new configuration file using the — config.file flag:
./prometheus - config.file=exporter.yml
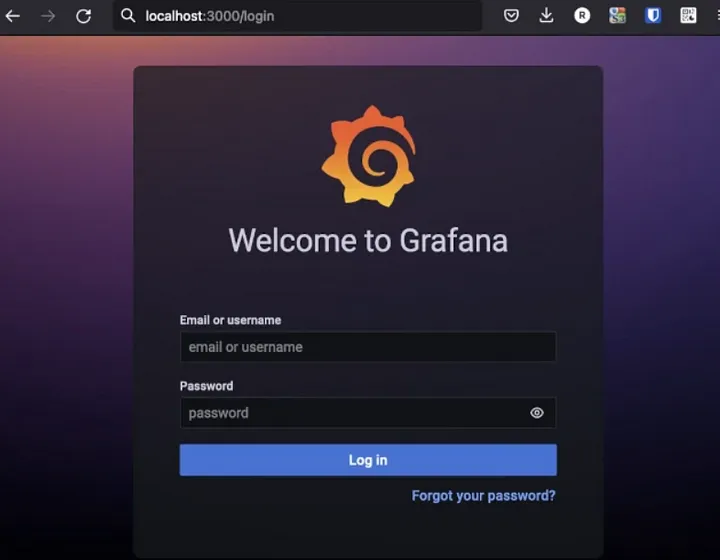
Setting up the Grafana Dashboard to view the matrics
Launch your web browser and enter the Grafana Dashboard URL: http://{ip of your virtual machine}:3000/login
Use the following default login details:
Username: admin
Password: admin
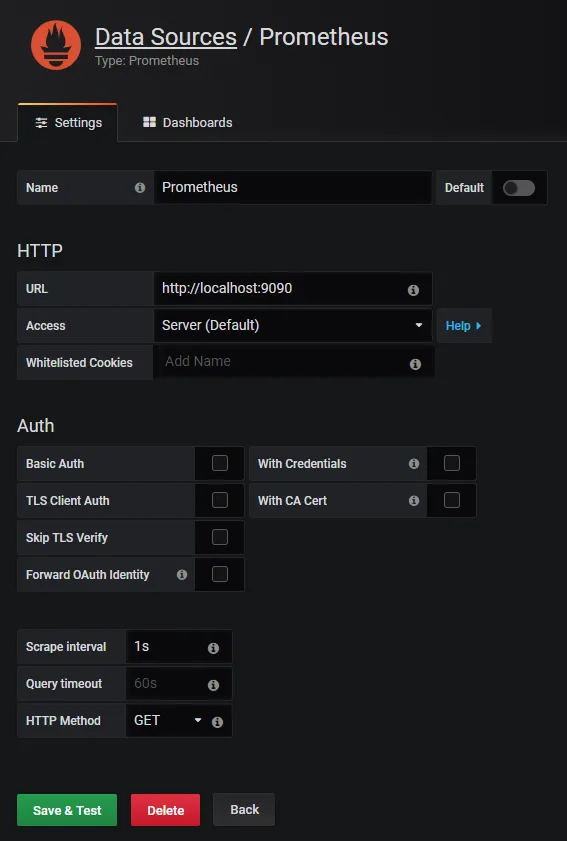
- Now we need to add a data source for our grafana. here we are using prometheus as a data source so add a prometheus as data source.
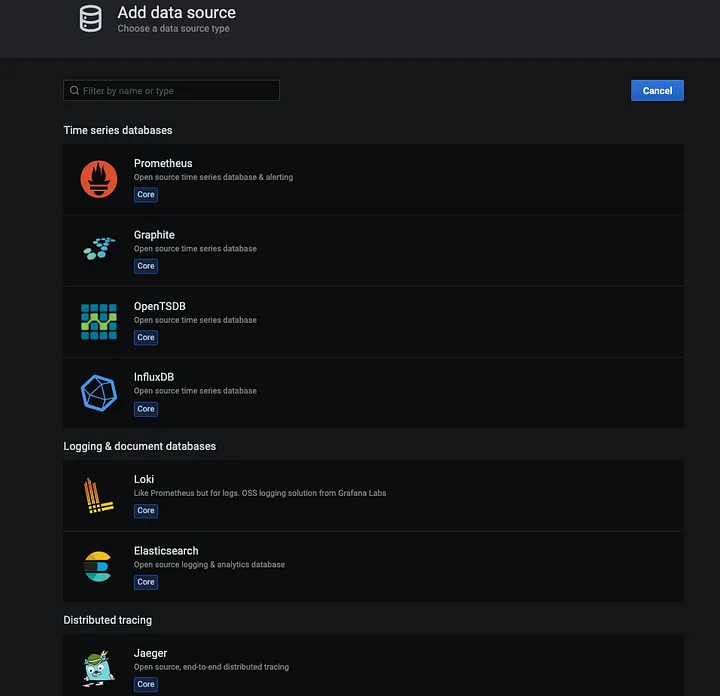
- Enter the host name or the ip address of prometheus server and save and test the data source
Now that we’ve completed the setup, you’re ready to dive into visualizing beautiful and insightful dashboards. With Prometheus collecting data from both local and remote Node Exporters, and Grafana providing a user-friendly interface, you have a powerful monitoring solution at your fingertips.
- To import the dashboard visit https://grafana.com/grafana/dashboards/ here we can find various dashboards developed by other developers we can get them or we can buid our own.
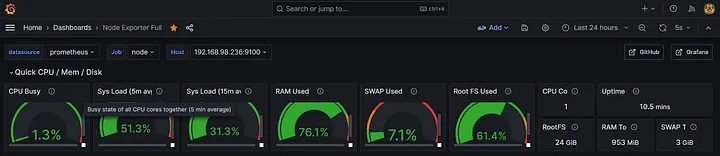
- Here we will be importing the Node Exporter Full to import that dashboard we will download the json file and copy paste the content of json file to our grafana dashboard import section and select the datasource and click on import.
- You’re all set to visualize beautiful and informative metrics. The combination of Prometheus and Grafana provides a powerful monitoring solution that allows you to gain insights into your system’s performance.

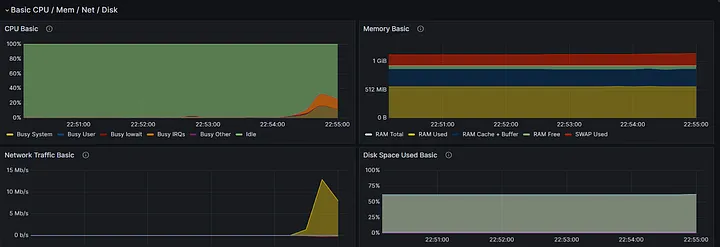
Now you can explore and customize your dashboards further, adding additional panels, experimenting with different visualizations, and setting up alerts to be notified of any abnormal system behavior. Monitoring with Prometheus and Grafana opens up a world of possibilities for understanding and optimizing your infrastructure.
Happy monitoring!


Top comments (0)